How to compare the parts of your business that matter most
Most organisations can benchmark financial performance, but few can compare the performance of their own functions. This article explores why measuring efficiency and effectiveness separately, using common and function-specific ratios, gives leaders a clearer view of where value is created, where it’s lost, and where to focus improvement.
Reading time: 6 minutes
You can compare your share price to the whole market every second of the trading day. You can compare your margin to your competitors’, your growth to your sector’s, your total return to an index running back decades. Comparison is everywhere in the financial world, and it’s how you know whether a number is good or just a number.
Now try to answer a simpler question about your own business. Is your finance function good? Is your HR function good? Not “does it stay within budget” – good. Efficient for what it costs, and effective at what it actually produces. Most leaders can’t answer that, and it isn’t because they’re short of data. It’s because they’ve never had the one thing that makes a number mean anything: something to compare it to.
The view that doesn’t exist
A function can be perfectly efficient and completely ineffective – and until you can compare it, you will never tell the two apart.
The reason isn’t that people are ignoring their functional dashboards. It’s that a genuinely comparable functional view rarely exists in the first place, so there’s little to look at. Each function is measured in its own language, on metrics it chose, against targets it set. Finance talks about close times and controls. HR talks about engagement and time-to-hire. Operations talks about service levels. All reasonable in isolation, and all completely incomparable. You cannot lay them side by side and ask which function is carrying its weight, because they aren’t measured on the same terms – so, mostly, no one tries.
That’s a genuine shame, because building the view is one of the most powerful things a leadership team can do, and it isn’t complicated once you decide to do it.
Two kinds of comparison
It comes down to two kinds of ratio, working together.
The first are common ratios – the same handful of measures applied identically to every function. What share of total headcount does each one hold? What share of operating cost? What does an average full-time head cost in one function against another? Put every function on those same axes and, for the first time, they become comparable to each other. You start to see that one function has quietly grown to a far larger share of cost than anyone realised, or that another is running on a fraction of the resource of its peers. Nothing exotic – just the same questions asked of everyone, which almost never happens.
The second are unique ratios – measures specific to what each function actually does, because “good” means something different in each. For finance, cost per invoice processed, or reconciliations completed per head. For HR, cost per hire, or learning investment per employee. For retail operations, revenue per store colleague. These don’t tell you what a function costs. They tell you what it produces for that cost – which is the thing common ratios can’t reach.
Cheap is not the same as good
Put the two together and you get the reading that changes the whole conversation: efficiency and effectiveness, measured separately, inside every function.
Efficiency is the cost of running the function. Effectiveness is whether that spend produces anything worth having. They are not the same thing, and in practice they routinely point in opposite directions. We worked with a business whose HR function looked excellent on cost – cost per hire well below benchmark, a lean team, a tidy budget. On a pure efficiency read, a model function. But the effectiveness ratios told the opposite story. The quality of those cheap hires was poor, early attrition was high, and the business was quietly re-recruiting a large share of those roles inside a year. The function was highly efficient at doing something that wasn’t working. Cheap hiring was costing a fortune – it just wasn’t costing it in the HR budget, so no one had joined the two up.
You cannot see that in a single number, and you certainly can’t see it without a comparable view. A function can be perfectly efficient and completely ineffective, and until you can compare it – across the other functions, and against what it’s actually meant to produce – you will never tell the two apart.
Comparable, and reconciled
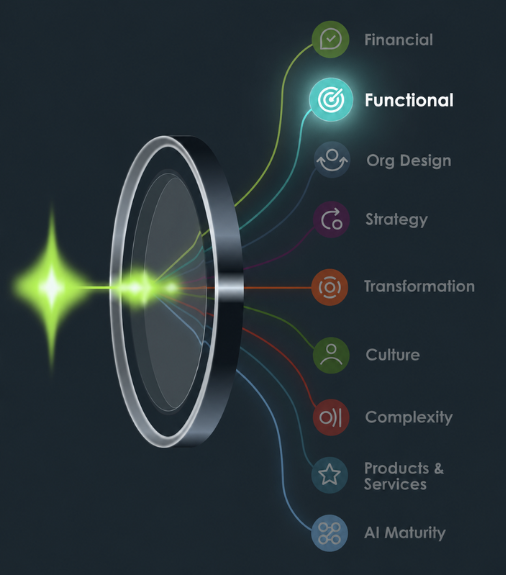
This is the functional lens of the Organisational Performance Diagnostic, and it’s one of the parts clients find most immediately useful, because it hands them a view they’ve genuinely never had. Every function measured on common ratios that make them comparable. Unique ratios that show what each one actually produces. Efficiency and effectiveness read separately rather than blurred into a single cost line. And the whole thing reconciled to the group accounts, so it isn’t a management theory – it’s your own money, seen properly for the first time. It turns “I think finance is probably fine” into something you can actually see, benchmark and act on.
Where to start
Pick two functions that feel completely different – say finance and operations. Ask for three numbers on each, on exactly the same basis: their share of total cost, their cost per head, and one honest measure of what they produce for that spend. The awkwardness of getting even those six numbers onto a comparable footing is the finding. It’s the sign that you’ve been running functions you’ve never truly been able to compare – which means you’ve been managing them half-blind.
The Organisational Performance Diagnostic
The Q5 Organisational Performance Diagnostic builds the comparable functional view most businesses have never had – common ratios across every function, unique ratios within each, efficiency and effectiveness read separately, all reconciled to your accounts. If you can’t yet say whether your functions are good, that’s exactly the view we build. We’d welcome the conversation. Learn more.
Get in touch
See what your organisation has been missing
Discover how the Q5 Organisational Performance Diagnostic gives leaders a comparable view of every function, helping identify where value is created, where it’s being lost, and where to focus next. Complete the form below and we’ll be in touch.

 by
by